A couple of months before my recent retirement from MathWorks, I was working on my last feature project for the Image Processing Toolbox. I thought everything was all set to go, but when I was preparing “bash” instructions for testing the feature, I found a bug in my code. Although I was certainly happy to have found the bug before the feature shipped, I was disappointed to have found it fairly late in the development process. I realized that I would have found and fixed the problem easily and much earlier, if only I hadn’t forgotten an old and valuable coding habit.
In my early days at MathWorks, learning to be a software developer, there were several books that I found particularly influential and helpful. One was Writing Solid Code by Steve Maguire. There was one chapter in particular that I incorporated directly into my routine: “Step through Your Code.”
The best way to write bug-free code is to actively step through all new or modified code to watch it execute, and to verify that every instruction does exactly what you intend it to do.
–Steve Maguire
Just watch your code execute, one line at a time, by stepping through it in the debugger. It seems almost too simple to have a big impact, but in my repeated experience, I often did find bugs, almost-bugs, or worthwhile code improvements to make. The process helped me gain confidence that my code was solid and ready for code review, testing, and submission, and so I did it every time.
I got out of the habit because of a years-long period during which I did not write product code. Then, by the time I returned to the Image Processing Toolbox team and started writing product code again, I had gotten out of the habit of printing things.
Not printing mattered because of the way I used code printouts for my step-through process. I would pick a set of inputs and then start the code in the debugger. As I stepped through the code execution, I would highlight the executed lines on a printout. Very frequently, I would inspect values in the code to make sure they were as I expected.
Then, I would choose a different set of inputs so that I could watch code lines that hadn’t been executed yet, and I would start again. I would keep doing this until all the code lines were highlighted.
Here is a recent example, from my work on “Initialize a MATLAB Toolbox”. From my handwritten scribbles, you might be able to tell that I identified a case to add to my test suite, and I also had an idea for a possible code improvement. The highlights show that there is one code line, a call to error, that I haven’t watched yet.
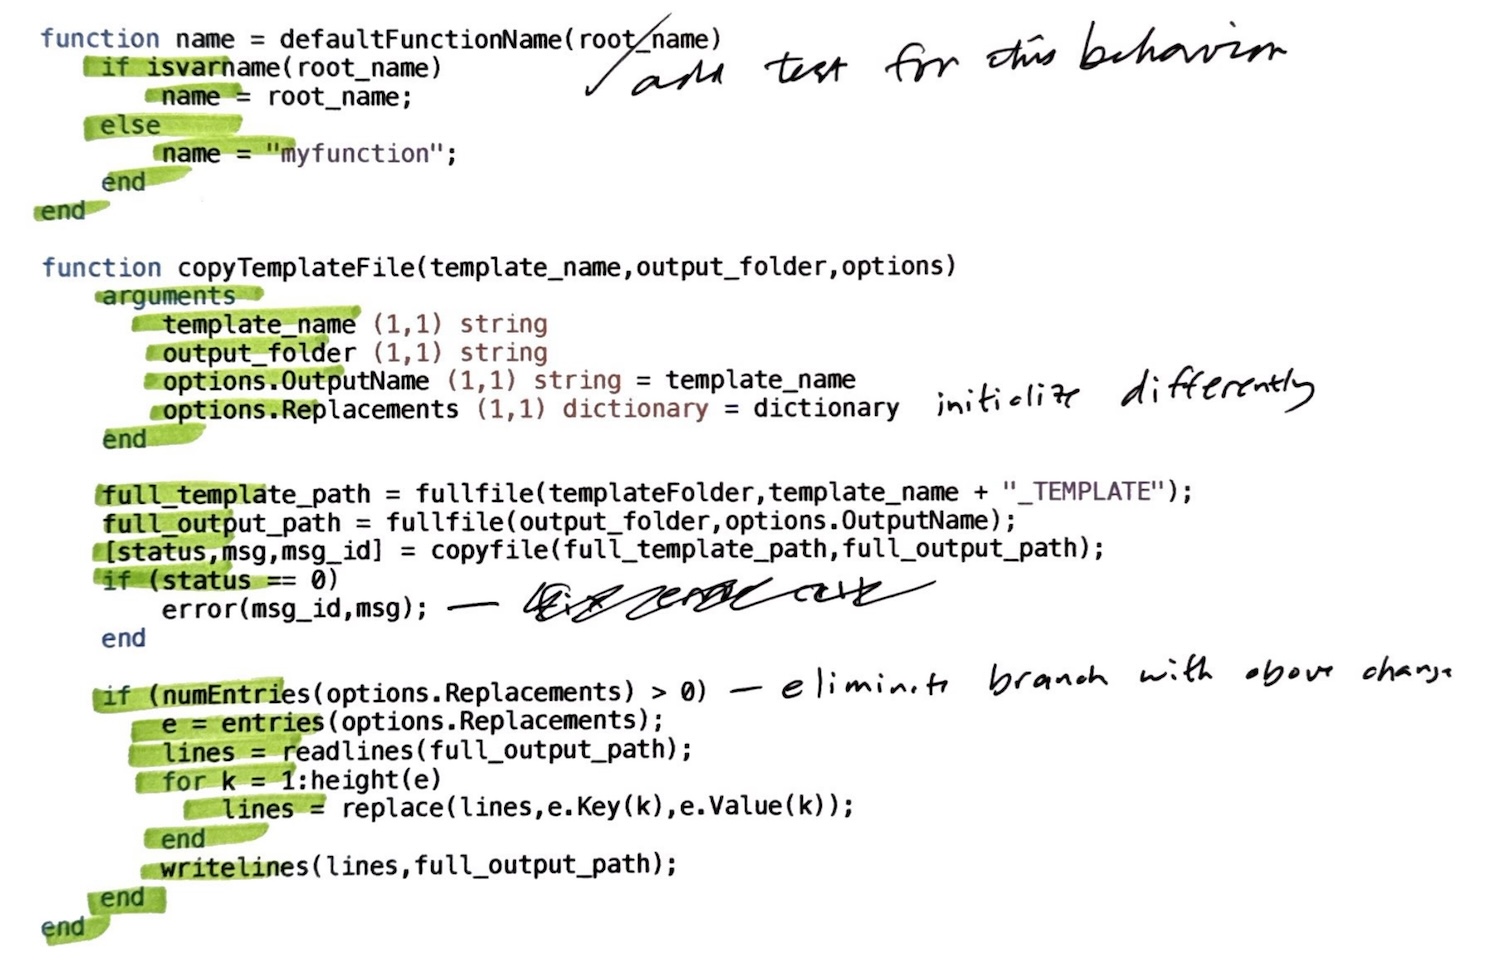
Sample printout showing highlighted code lines
When developers first hear about this technique, they almost always think that it would be too much trouble, or that it would take too much time. It really only takes a few minutes, though, in my experience. It takes way more time than that if you have to fix something later, after the code has been submitted.
A more significant objection, I think, is that many developers today rarely print anything. There might not even be a printer nearby. To solve that problem, I would love to see a code editor feature that would support this kind of visual inspection of code execution. Perhaps the editor could visibly mark code lines whenever the debugger stops on them.
Many people will see this suggestion and think that a code coverage report will do the trick, but I don’t think so. I’m looking for something that is more interactive, something that will update and keep track as I watch the code execute, a line at a time.
I have submitted an enhancement request to MathWorks to consider adding something like this to the MATLAB Editor.